Projects / Data Science
Titanic Survival Prediction
Machine Learning Model for Titanic Survival Prediction.

Titanic Survival Prediction Project
Project Overview
This project focuses on building a machine learning model to predict the survival outcomes of passengers aboard the ill-fated Titanic, leveraging the renowned Titanic dataset. The primary objective is to identify key factors influencing survival and develop a robust classification model using standard data science methodologies.
Data Source
The dataset used for this analysis is the publicly available Titanic dataset, commonly accessed via the Seaborn library, originally sourced from Kaggle.
Exploratory Data Analysis (EDA)
A comprehensive EDA was conducted to understand the dataset's structure, identify patterns, and uncover insights relevant to passenger survival. This involved analyzing data distributions, relationships between features, and identifying missing values.
Initial inspection revealed the presence of missing data across several columns, notably in 'Age' and 'Deck'. Visualizations helped quantify the extent of these missing entries:
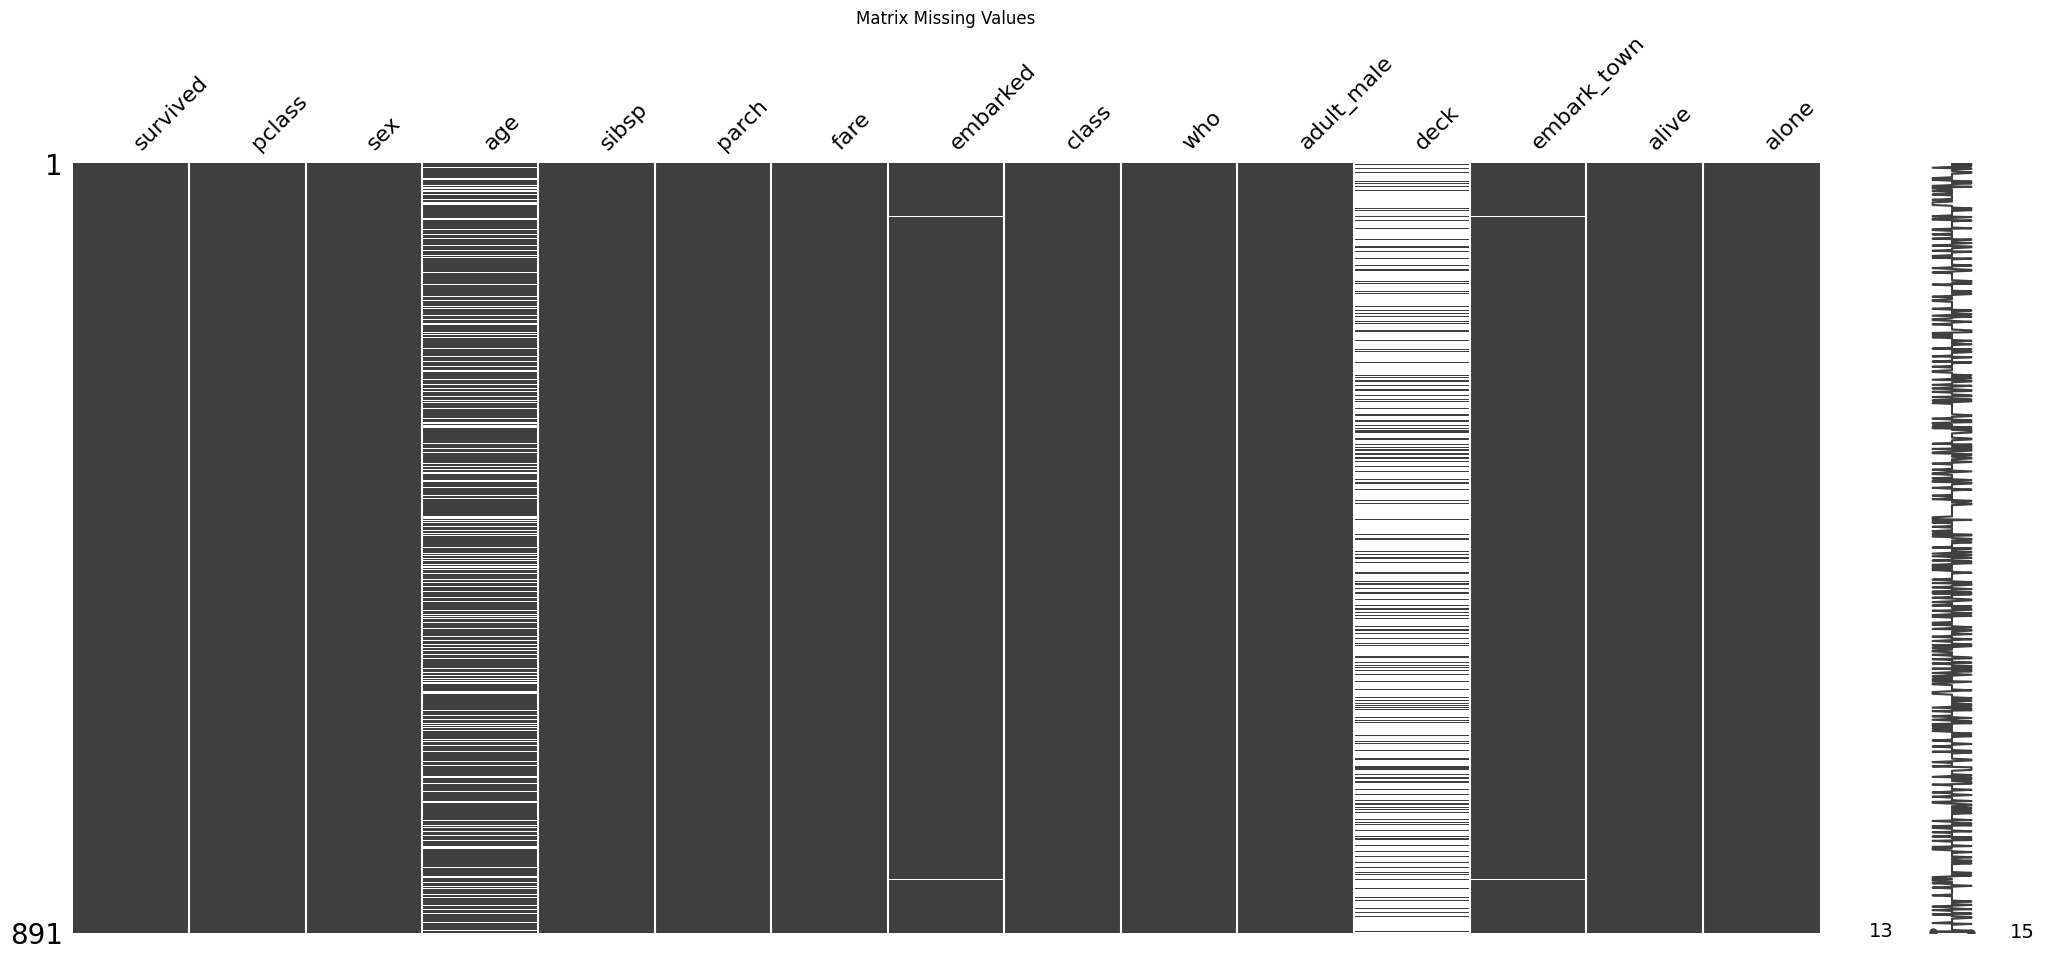 (Figure 1: Visualization of Missing Values)
Analysis of individual features highlighted key patterns influencing survival:
-
Gender (
sex): A significant disparity was observed, with females exhibiting a substantially higher survival rate.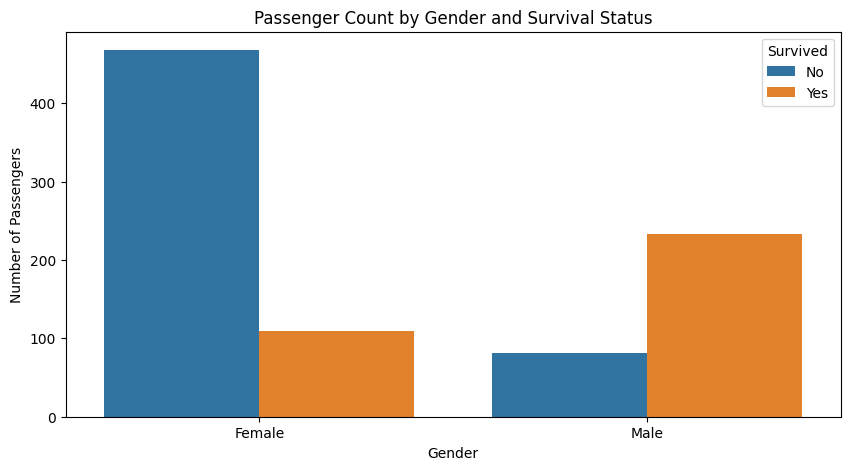 (Figure 2: Survival Rate by Gender)
-
Passenger Class (
pclass): Higher passenger classes showed better survival rates, aligning with the "women and children first" protocol which often favored passengers in upper classes.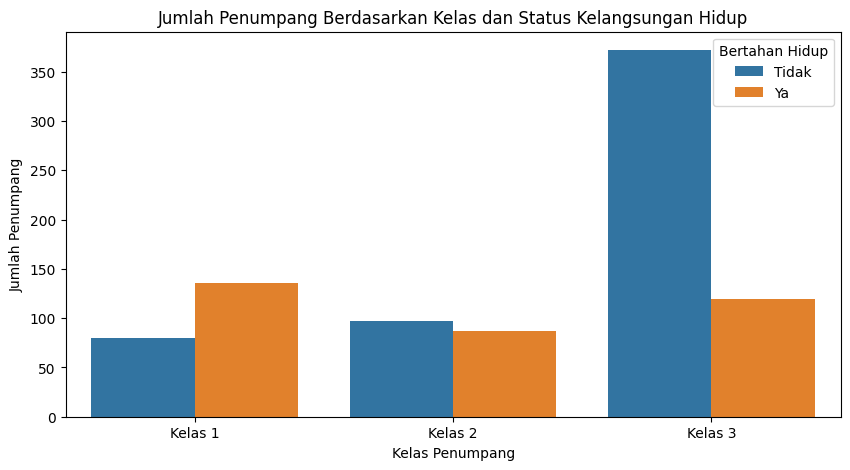 (Figure 3: Survival Rate by Passenger Class)
-
Age (
age): Younger passengers, particularly children, appeared to have a higher probability of survival.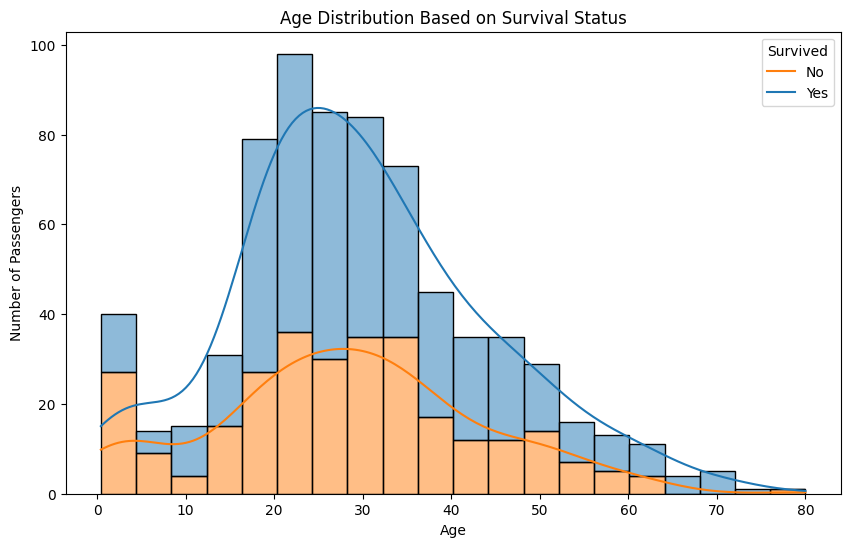 (Figure 4: Age Distribution based on Survival Status)
-
Family Size (Engineered Feature): Creating a
family_sizefeature by combiningsibspandparchrevealed that individuals traveling alone or in very large families had lower survival rates compared to those in small to medium-sized families.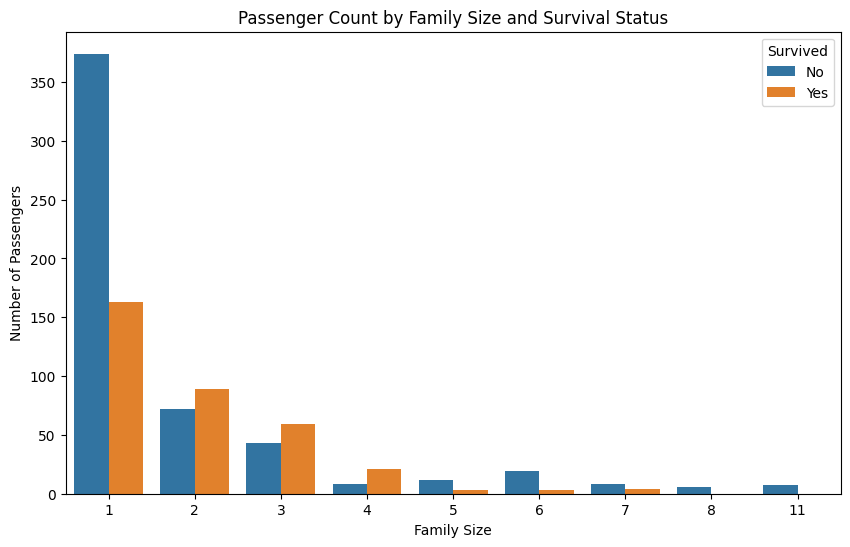 (Figure 5: Survival Rate by Family Size)
A correlation heatmap of numerical features provided insight into linear relationships within the data:
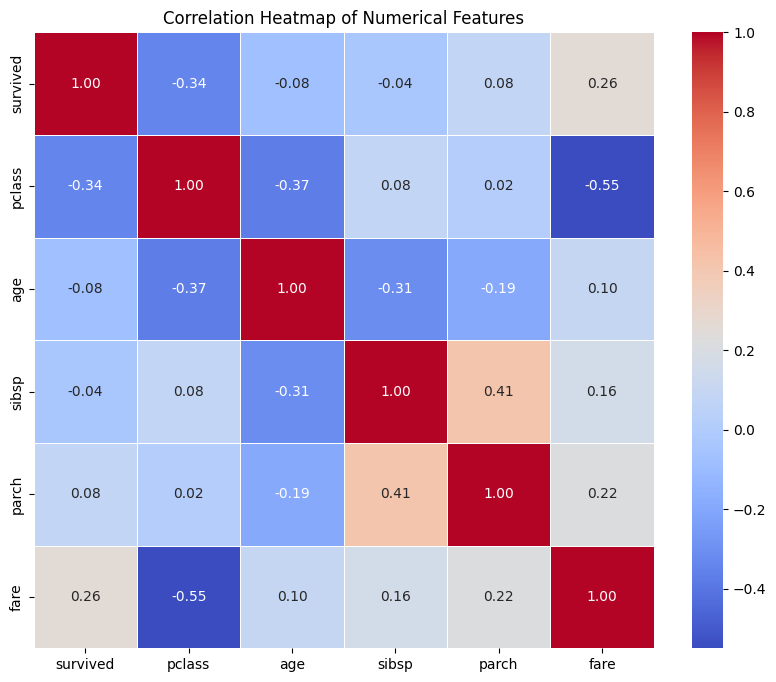 (Figure 6: Correlation Heatmap of Numerical Features)
Data Preprocessing
A robust preprocessing pipeline was established using Scikit-learn's ColumnTransformer to handle different feature types effectively:
- Numerical Features: Missing values in numerical columns (like 'Age' and 'Fare') were imputed using the median strategy to handle potential outliers. These features were then scaled using
StandardScalerto ensure they have zero mean and unit variance, preventing features with larger scales from dominating the model. - Categorical Features: Missing values in categorical columns (like 'Embarked') were imputed using the most frequent strategy. These features were then transformed into a numerical format suitable for machine learning models using
OneHotEncoder, which creates binary columns for each category. Thehandle_unknown='ignore'parameter was used to gracefully handle any unseen categories in the test set.
This preprocessing was encapsulated within a Pipeline to streamline the workflow and prevent data leakage during cross-validation.
Model Selection and Training
To assess different modeling approaches for this classification task, several algorithms were explored:
- Random Forest Classifier: Chosen for its ability to capture complex non-linear relationships and provide feature importance.
- K-Nearest Neighbors (KNN): Selected as a simple, non-parametric baseline model.
- Logistic Regression: Included as a linear model to understand the effectiveness of a simpler approach.
Each model was trained using GridSearchCV combined with StratifiedKFold cross-validation on the training data. GridSearchCV systematically searched for the optimal combination of hyperparameters for each model (e.g., n_estimators, max_depth for Random Forest; n_neighbors, weights for KNN; C, penalty for Logistic Regression) to maximize performance. StratifiedKFold was used to ensure that each fold of the cross-validation had a representative proportion of both survival classes, which is important for imbalanced datasets.
Model Evaluation
The trained models were evaluated on a held-out test set using standard classification metrics to provide a comprehensive view of their performance.
The Confusion Matrix was a key tool to understand the nature of predictions (True Positives, True Negatives, False Positives, False Negatives):
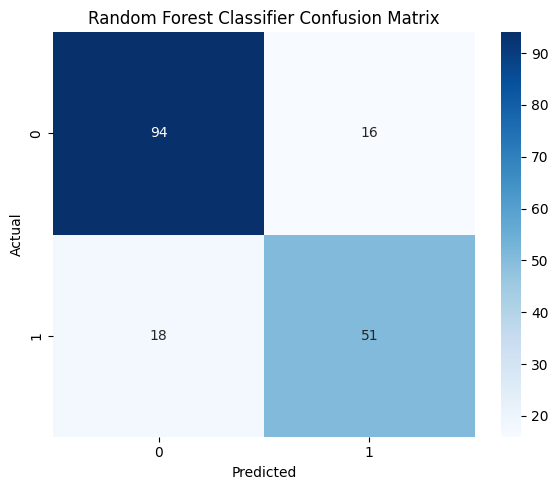
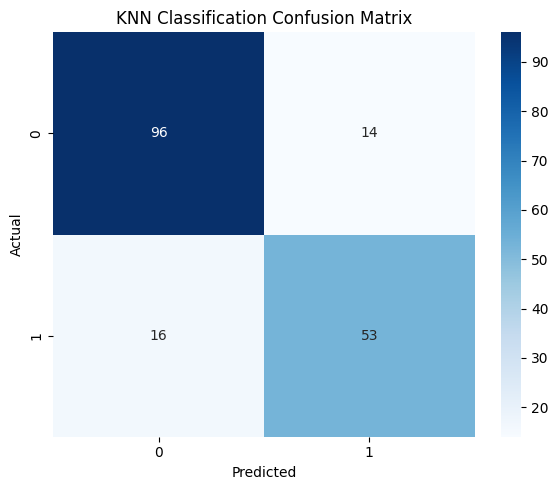
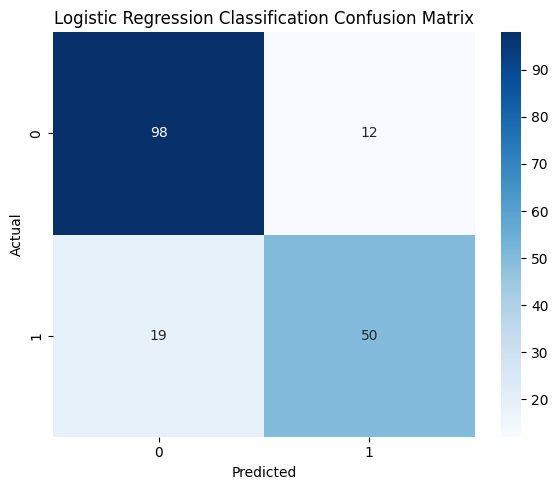 (Figure 7: Confusion Matrix for the Best Performing Model)
To further compare the models, the key metrics from the Classification Reports are summarized below:
| Model | Accuracy | Precision (weighted avg) | Recall (weighted avg) | F1-score (weighted avg) |
|---|---|---|---|---|
| Random Forest | 0.81 | 0.81 | 0.81 | 0.81 |
| KNN | 0.83 | 0.83 | 0.83 | 0.83 |
| Logistic Regression | 0.83 | 0.83 | 0.83 | 0.82 |
Analyzing these metrics provides a detailed view of how each model performed, particularly regarding its ability to correctly identify both surviving and non-surviving passengers.
Results and Conclusion
The evaluation results indicated that the KNN and Logistic Regression model achieved the highest accuracy on the test set, demonstrating strong predictive capability for Titanic survival. Key features identified through EDA and potentially further analysis (e.g., feature importance from Random Forest) such as sex, pclass, fare, and family_size were strong indicators of survival.
Future Enhancements
Potential areas for future work include:
- Exploring more advanced feature engineering techniques.
- Investigating alternative missing value imputation strategies.
- Experimenting with a wider range of classification algorithms and ensemble methods.
- Performing more in-depth error analysis to understand misclassifications.
- Implementing techniques for handling potential class imbalance.
This project provided valuable insights into factors influencing survival, such as the significant impact of gender, passenger class, age, and family size. Learned how to perform exploratory data analysis to uncover these relationships, preprocess data by handling missing values and transforming features, also apply and evaluate various machine learning classification models like Random Forest, K-Nearest Neighbors, and Logistic Regression to predict survival outcomes.