Projects / Data Science
King County House Price Prediction
Data Analytics for House Pricing Data Set.
Overview
This project focuses on predicting house sale prices in King County, Washington, using a dataset of homes sold between May 2014 and May 2015. By applying various data analysis and machine learning techniques, we aim to build a model that can accurately estimate house prices based on their characteristics.
Project Goals
The main goals of this project are:
- To explore and understand the factors influencing house prices in King County.
- To clean and preprocess the raw dataset for analysis.
- To perform exploratory data analysis (EDA) to identify trends and relationships between features and price.
- To develop and evaluate different regression models for price prediction.
- To determine the most effective model for predicting house prices based on the available data.
This project demonstrates skills in data wrangling, exploratory data analysis, statistical modeling, and model evaluation using Python libraries such as pandas, numpy, matplotlib, seaborn, and scikit-learn.
Project Summary
This project aims to predict house sale prices in King County, including Seattle, using a dataset of homes sold between May 2014 and May 2015. The dataset contains various features related to houses in King County, including sale price, number of bedrooms and bathrooms, square footage, floor count, waterfront view, condition, grade, year built, year renovated, and location information (zipcode, latitude, longitude).
Methods Applied:
- Data Cleaning: Irrelevant columns ('id' and 'Unnamed: 0') were dropped. Missing values in the 'bedrooms' and 'bathrooms' columns were handled by replacing them with the mean of the respective columns.
- Exploratory Data Analysis (EDA): The distribution of the 'floors' variable was examined using
value_counts(). The relationship between 'waterfront' and 'price' was visualized using a box plot, indicating a significant difference in price for houses with a waterfront view. A regression plot was used to show the relationship between 'sqft_above' and 'price', suggesting a positive linear relationship. The correlation of all numerical features with 'price' was calculated and sorted to identify features with strong relationships. - Model Development: Several linear regression models were built, including simple linear regression, multiple linear regression, and a pipeline model incorporating
StandardScaler,PolynomialFeatures, andLinearRegression. - Model Evaluation and Refinement: The data was split into training and testing sets using
train_test_split. Ridge regression models were applied to the data, both with and without polynomial features, to assess their performance and address potential multicollinearity.
Key Findings and Results:
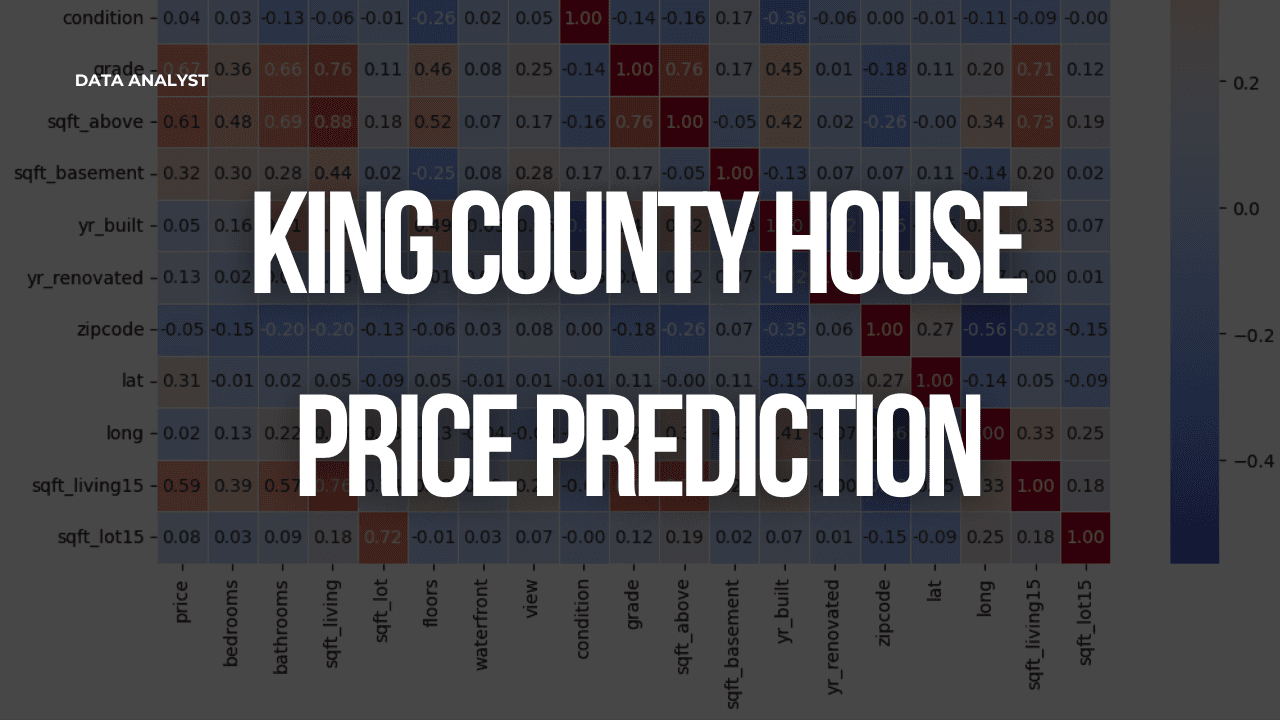
- Features like 'sqft_living', 'grade', 'sqft_above', 'sqft_living15', and 'bathrooms' showed the strongest positive correlation with 'price'. 'Zipcode' had a negative correlation.
- The simple linear regression model with 'sqft_living' achieved an R-squared score of approximately 0.49.
- The multiple linear regression model with the selected features achieved an R-squared score of approximately 0.66.
- The pipeline model with polynomial features showed an improved R-squared score of approximately 0.75 on the training data.
- When evaluated on the test set, the Ridge regression model achieved an R-squared score of approximately 0.65, while the Ridge regression model with polynomial features achieved a higher R-squared score of approximately 0.70, indicating that polynomial features and regularization improved the model's performance on unseen data.
Visualizations
Here are some key visualizations from the exploratory data analysis:
Price Distribution for Houses With and Without Waterfront View
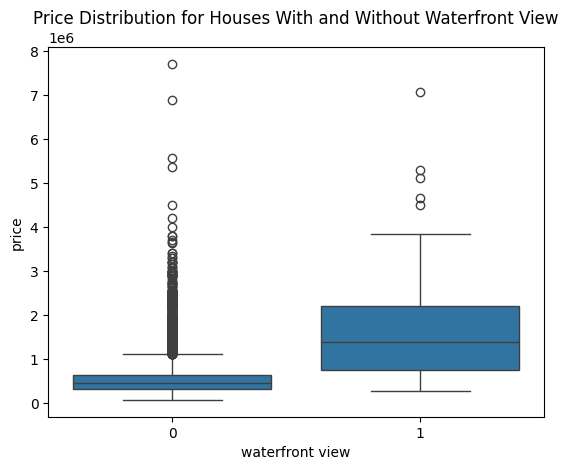 This box plot shows the distribution of house prices for properties with and without a waterfront view. It clearly indicates that houses with a waterfront view tend to have significantly higher prices.
Relationship Between sqft_above and Price
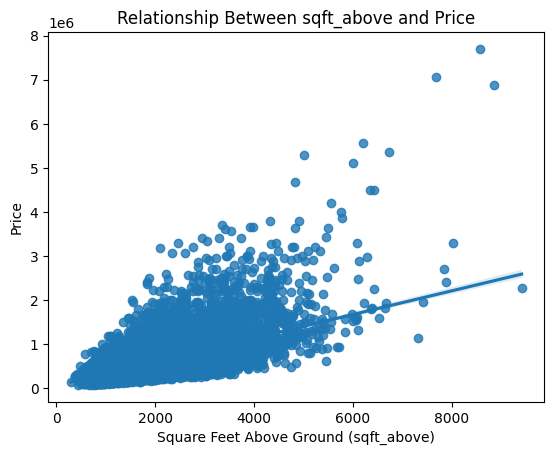 This regression plot illustrates the positive linear relationship between the square footage above ground ('sqft_above') and the house price. As the square footage increases, the price generally tends to rise.
Dataset
This project utilizes the King County House Sales dataset, which can be accessed at: https://cf-courses-data.s3.us.cloud-object-storage.appdomain.cloud/IBMDeveloperSkillsNetwork-DA0101EN-SkillsNetwork/labs/FinalModule_Coursera/data/kc_house_data_NaN.csv
This project demonstrates my ability to apply data analysis and machine learning to solve real-world problems by developing accurate house price prediction models. It showcases my skills in data cleaning, exploratory analysis, and model development, with a focus on delivering actionable insights for real estate professionals and homeowners.