Projects / Data Science
Rainfall Prediction Classifier
Machine Learning Model for Rainfall Prediction.

Project Overview
This project focuses on predicting whether it will rain tomorrow in specific locations within the Melbourne area of Australia. Using historical weather data, I built and evaluated machine learning models, specifically Random Forest and Logistic Regression, to forecast rainfall and assess their performance.
Problem Statement
The problem addressed is the prediction of daily rainfall in select locations around Melbourne. The goal was to develop and compare machine learning classification models to accurately predict the occurrence of rain the following day based on various weather parameters.
Data
The dataset used is the weatherAUS-2.csv file obtained from a provided URL. It contains daily weather observations from various locations in Australia.
- Overview: The dataset contains observations of weather metrics for each day from 2008 to 2017, and includes the following fields:
| Field | Description | Unit | Type |
|---|---|---|---|
| Date | Date of the Observation in YYYY-MM-DD | Date | object |
| Location | Location of the Observation | Location | object |
| MinTemp | Minimum temperature | Celsius | float |
| MaxTemp | Maximum temperature | Celsius | float |
| Rainfall | Amount of rainfall | Millimeters | float |
| Evaporation | Amount of evaporation | Millimeters | float |
| Sunshine | Amount of bright sunshine | hours | float |
| WindGustDir | Direction of the strongest gust | Compass Points | object |
| WindGustSpeed | Speed of the strongest gust | Kilometers/Hour | object |
| WindDir9am | Wind direction averaged over 10 minutes prior to 9am | Compass Points | object |
| WindDir3pm | Wind direction averaged over 10 minutes prior to 3pm | Compass Points | object |
| WindSpeed9am | Wind speed averaged over 10 minutes prior to 9am | Kilometers/Hour | float |
| WindSpeed3pm | Wind speed averaged over 10 minutes prior to 3pm | Kilometers/Hour | float |
| Humidity9am | Humidity at 9am | Percent | float |
| Humidity3pm | Humidity at 3pm | Percent | float |
| Pressure9am | Atmospheric pressure reduced to mean sea level at 9am | Hectopascal | float |
| Pressure3pm | Atmospheric pressure reduced to mean sea level at 3pm | Hectopascal | float |
| Cloud9am | Fraction of the sky obscured by cloud at 9am | Eights | float |
| Cloud3pm | Fraction of the sky obscured by cloud at 3pm | Eights | float |
| Temp9am | Temperature at 9am | Celsius | float |
| Temp3pm | Temperature at 3pm | Celsius | float |
| RainToday | If there was at least 1mm of rain today | Yes/No | object |
| RainTomorrow | If there is at least 1mm of rain tomorrow | Yes/No | object |
- Source: https://www.kaggle.com/datasets/jsphyg/weather-dataset-rattle-package
- Key Features: Date, Location, MinTemp, MaxTemp, Rainfall, Evaporation, Sunshine, WindGustDir, WindGustSpeed, WindDir9am, WindDir3pm, WindSpeed9am, WindSpeed3pm, Humidity9am, Humidity3pm, Pressure9am, Pressure3pm, Cloud9am, Cloud3pm, Temp9am, Temp3pm, RainToday, RainTomorrow
- Initial Data State: The original dataset had 145,460 entries but contained a significant number of missing values across many columns.
- Data Cleaning: Rows with any missing values were dropped, reducing the dataset size to 56,420 entries. The data was then filtered to include only locations in the Melbourne area: 'Melbourne', 'MelbourneAirport', and 'Watsonia', resulting in 7,557 entries.
- Feature Engineering: The 'RainToday' column was renamed to 'RainYesterday', and 'RainTomorrow' was renamed to 'RainToday' for clarity in the context of prediction. A 'Season' feature was created by extracting the month from the 'Date' column and mapping it to meteorological seasons. The original 'Date' column was then dropped.
Methodology
The project followed a standard machine learning workflow:
- Data Splitting: The dataset was split into training (80%) and testing (20%) sets using
train_test_split, withstratify=yto maintain the proportion of rainy/non-rainy days in both sets. - Preprocessing:
- Scaling: Numeric features (MinTemp, MaxTemp, Rainfall, Evaporation, Sunshine, WindGustSpeed, WindSpeed9am, WindSpeed3pm, Humidity9am, Humidity3pm, Pressure9am, Pressure3pm, Cloud9am, Cloud3pm, Temp9am, Temp3pm) were scaled using
StandardScaler. - Encoding: Categorical features (Location, WindGustDir, WindDir9am, WindDir3pm, RainYesterday, Season) were one-hot encoded using
OneHotEncoder. - Pipeline: A
ColumnTransformerwas used to apply the correct preprocessing steps to different feature types, and aPipelinecombined the preprocessing and model training steps.
- Scaling: Numeric features (MinTemp, MaxTemp, Rainfall, Evaporation, Sunshine, WindGustSpeed, WindSpeed9am, WindSpeed3pm, Humidity9am, Humidity3pm, Pressure9am, Pressure3pm, Cloud9am, Cloud3pm, Temp9am, Temp3pm) were scaled using
- Model Selection: Random Forest and Logistic Regression classifiers were chosen for their common use in classification tasks and interpretability (especially Logistic Regression).
- Hyperparameter Tuning:
GridSearchCVwithStratifiedKFoldcross-validation (5 splits) was used to find the optimal hyperparameters for each model based on accuracy. - Evaluation: Model performance was evaluated using several metrics: Accuracy, Precision, Recall, F1-score (obtained from
classification_report), Confusion Matrix, and Area Under the ROC Curve (AUC). These metrics provide a comprehensive view of the models' performance, especially for an imbalanced dataset like this, where predicting the minority class ('Yes' for rain) is crucial.
Results and Interpretation
The models were trained and evaluated, yielding the following results:
-
Model 1: Random Forest
- Best Parameters: {'classifier__max_depth': None, 'classifier__min_samples_split': 5, 'classifier__n_estimators': 100}
- Cross-Validation Score: 0.85
- Test Set Score: 0.84
- Classification Report:
                  precision    recall  f1-score   support

          No       0.86      0.94      0.90      1154
         Yes       0.74      0.51      0.60       358

    accuracy                           0.84      1512
   macro avg       0.80      0.73      0.75      1512
weighted avg       0.83      0.84      0.83      1512
The Random Forest model achieved an overall accuracy of 84%. For the 'Yes' class (rain), it had a precision of 0.74 (meaning 74% of its rain predictions were correct) and a recall of 0.51 (meaning it only identified 51% of the actual rainy days).
- Confusion Matrix:
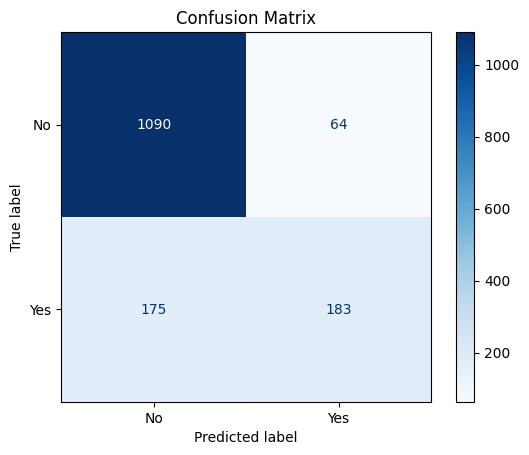
- True Positives (TP): 183
- True Negatives (TN): 1082
- False Positives (FP): 72
- False Negatives (FN): 175 The True Positive Rate (TPR) is 183 / (183 + 175) = 183 / 358 ≈ 0.511 or 51.1%. This means the model correctly predicted rain for about 51.1% of the days it actually rained.
- Feature Importance: [Insert or link to the Random Forest feature importance plot from cell
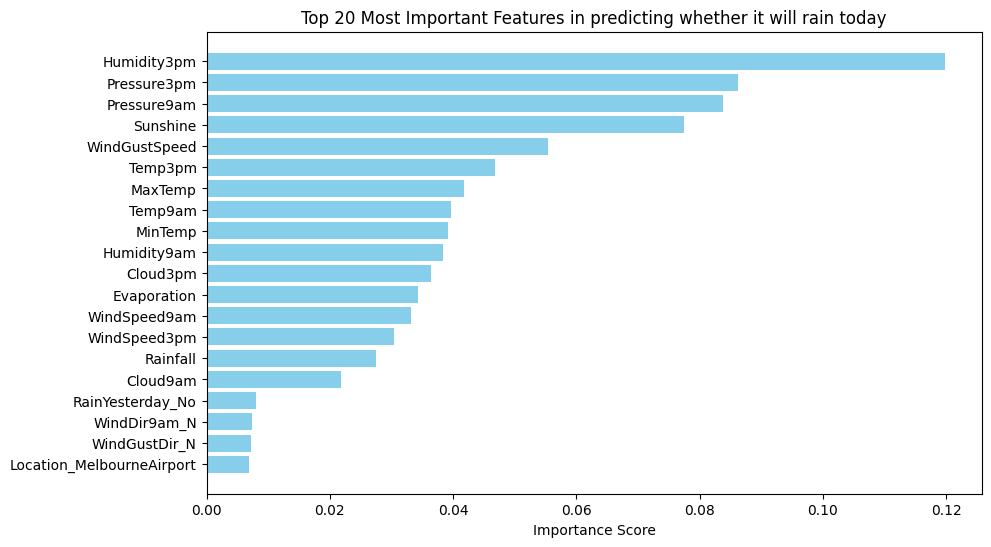
ghc2prUk56kz] The feature importance plot shows the relative importance of each feature in the Random Forest model's prediction. Features like Humidity3pm, Sunshine, Cloud3pm, and WindGustSpeed appear to be among the most influential.
-
Model 2: Logistic Regression
- Best Parameters: {'classifier__class_weight': None, 'classifier__penalty': 'l1', 'classifier__solver': 'liblinear'} (based on the final grid search)
- Cross-Validation Score: 0.83
- Test Set Score: 0.83 (based on classification report accuracy)
- Classification Report:
                  precision    recall  f1-score   support

          No       0.86      0.93      0.89      1154
         Yes       0.68      0.51      0.58       358

    accuracy                           0.83      1512
   macro avg       0.77      0.72      0.74      1512
weighted avg       0.82      0.83      0.82      1512
The Logistic Regression model achieved an overall accuracy of 83%. For the 'Yes' class, it had a precision of 0.68 and a recall of 0.51.
- Confusion Matrix:
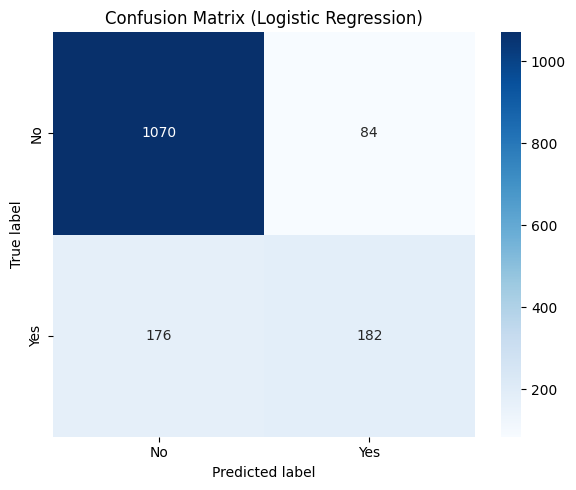 The Random Forest model generally performed slightly better, with fewer False Positives (64 vs 84) and a slightly higher number of True Positives (183 vs 182) and fewer False Negatives (175 vs 176) compared to the Logistic Regression model.
-
Model Comparison (ROC Curve and AUC):
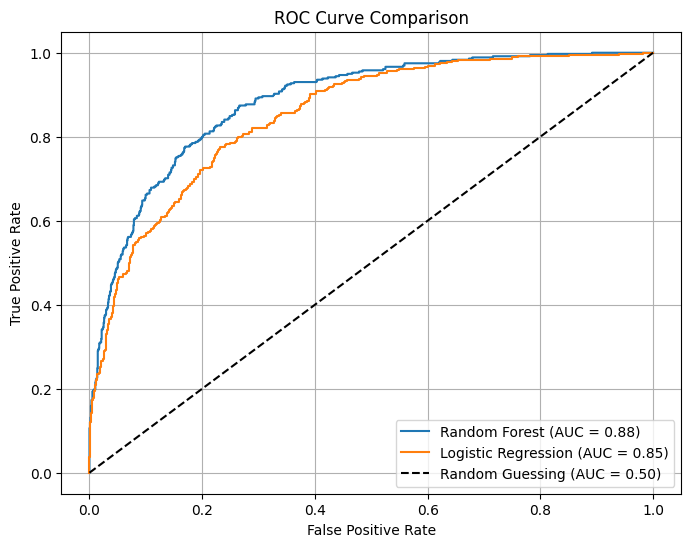
- AUC for Random Forest: 0.884
- AUC for Logistic Regression: 0.852
The ROC curve shows that the Random Forest model has a slightly higher AUC (0.884) compared to Logistic Regression (0.852), indicating that it is slightly better at distinguishing between rainy and non-rainy days.
-
Overall Interpretation: Both models achieved similar overall accuracy. However, the Random Forest model showed slightly better precision for predicting rain and a higher AUC. The recall for predicting rain ('Yes' class) was the same and relatively low for both models (0.51), suggesting that while the models are decent at identifying non-rainy days, they struggle to correctly identify all instances of actual rainfall. The True Positive Rate of around 51% confirms this limitation.
Top Features Importance
Conclusion
The project successfully implemented and compared Random Forest and Logistic Regression models for rainfall prediction in the Melbourne area. While both models provided reasonable overall accuracy, their ability to correctly identify rainy days (recall) was limited. The Random Forest model showed a slight edge in overall performance and discrimination ability (AUC).